

Recently WBT has been discussing Gross State Product, and what it means – particularly with respect to the mining industry in Queensland. Here’s some more discussion of the figures between renewables engineer, Trevor Berrill, and Ian from the Paradigm Shift (4zzz fm 102.1 Fridays at noon).
| Industries with percentage of Gross State Product Agriculture, forestry and fishing | % 3.93 |
| Mining | 7.49 |
| Manufacturing | 10.54 |
| Electricity, gas, water and waste services | 3.04 |
| Construction | 8.47 |
| Wholesale trade | 5.67 |
| Retail trade | 5.62 |
| Accommodation and food services | 2.76 |
| Transport, postal and warehousing | 6.33 |
| Information media and telecommunications | 2.85 |
| Financial and insurance services | 5.75 |
| Rental, hiring and real estate services | 2.78 |
| Professional, scientific and technical services | 4.37 |
| Administrative and support services | 2.62 |
| Public administration and safety | 5.89 |
| Education and training | 4.76 |
| Health care and social assistance | 6.44 |
| Arts and recreation services | 0.79 |
| Other services | 2.10 |
| Ownership of dwellings (Gross operating surplus & mixed income All industries | 7.81 |

Discussion of figures relating to mining in Queensland
Trevor: Finding I am getting two different figures for Gross State Product from Feds and State Govt. – same breakdown – nothing like consistency across Govt.!!
Originally, I used this Source: ABS 5220.0, Australian National Accounts, State Accounts, 2013–14.
More recently I used this source: http://www.qgso.qld.gov.au/products/tables/gsp-factor-cost-industry-components/index.php
| Ian: Your original source (ABS date) makes mining look like the biggest industry in Queensland. |
Trevor: Yes, that’s true in 2017_18 … but look at the averages at the left side of the table from 1989. Mining varies a lot with boom and bust cycles as will agriculture with commodity prices and the climate impacts eg. cyclones, wind damage and flooding.
Ian: Here’s the ABS data. Averages are listed below these tables.
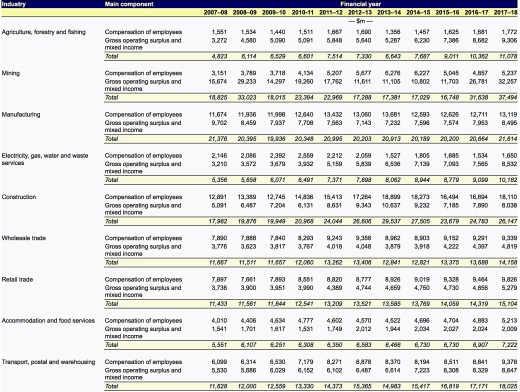
Gross state product at factor cost by industry and main components, Queensland, 2007–08 to 2017–18 (a)
The table below shows an industry breakdown of gross state product at factor cost. As these data are sourced from the Australian Bureau of Statistics, aggregate measures of compensation of employees and gross operating surplus and mixed income will not necessarily equal those estimates published in the Queensland State Accounts.


Trevor: Here’s the averages:
Employment in Mining
The other part of the equation is how many jobs are there in mining – it is not labour intensive and is getting less so? The two charts below are from ABS and show direct employment in March quarter 2019 and June quarter 2015. All mining is included in Other services and in 2015, when I searched for estimated mining jobs in coal and coal seam gas, these provided about 1.4% of direct jobs. It varies with the boom and bust cycles and development phase of the mine. The full details for 2019 are attached.
Job estimates in existing or new projects often include indirect employment and sometimes induced employment. These are defined as:
Direct employment includes those jobs created in the design, manufacturing, delivery, construction/installation, project management and operation and maintenance of the different components of the technology, project or power plant, under consideration.
Indirect employment refers to the ‘‘supplier effect’’of upstream and downstream suppliers.
Induced employment accounts for the expenditure – induced effects in the general economy due to the economic activity and spending of direct and indirect employees.
Job estimates including indirect and induced jobs are considered to be very “rubbery”. The coal industry’s methods to calculate indirect full-time jobs have been described as “biased” by the Australian Bureau of Statistics and “abused” by the Productivity Commission. For example, often job estimates don’t account for workers who simply transfer across to another industry sector and so don’t contribute to employment growth.
As well, those who work in mining are paid very high wages comparative to similar workers in other sectors. This simply concentrates wealth and distorts labour markets. It also means that if, for existential reasons, we need to progressively shut down and industry due to, for example climate change impacts of fossil fuel mining and use, then there is likely to be more resistance from the workers employed in that industry as they may have to transition to much lower but more “normal” wages levels.

